By the end of this lesson, you will:
So far, you’ve learned how to:
👏 Congratulations! you’ve successfully learned the basics of being a bookmaker!
But there’s one more crucial concept to understand...
When you set a market limit, you don’t want a single bet to use it all up.
If that happens:
💡 Solving this problem causes line movement.
If you’ve been exploring your bookmaker, you’ve probably noticed that odds change 📈📉.
Sports betting odds aren’t fixed they adjust as new information enters the market.
This change is called line movement in betting language, and it simply means changing odds.
Bookmakers move lines to:
If your market limit is $4, you might only allow $0.50 per bet at a time, and adjust your odds incrementally as bets come in.
This approach helps you:
📚 Exactly how this is done requires knowledge in advanced probability and statistics (outside this scope of this course).
But even without mastering the math, knowing about line movement helps you bet smarter.
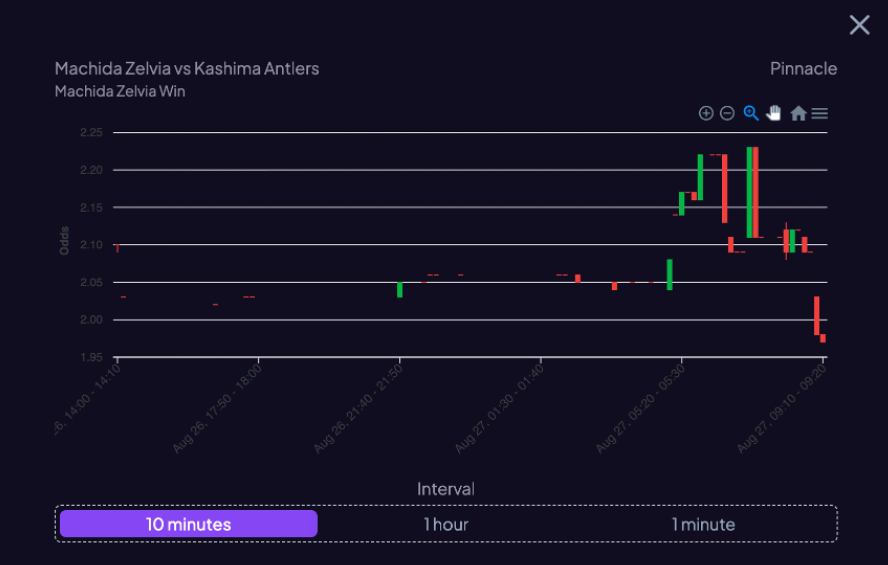
The chart above shows line movement for the Moneyline market, in a match between Machida Zelvia and Kashima Antlers on Pinnacle.
The tracked outcome:
You can see how the odds fluctuated:
If you’re familiar with trading 📊, you might recognize this as a candlestick graph. If not, take a few minutes to Google “how to read a candlestick graph” It’s a useful skill because many line movement tools use this format.
Sports betting is all about markets and odds. As a smart punter, your goal should always be:
Let’s use the chart above as an example 👇
Intuitively, when would you want to place your bet on Machida Zelvia to Win?
✅ At the highest odds (2.20) right ?, because it gives you the highest payout!
Let’s compare two punters 👇
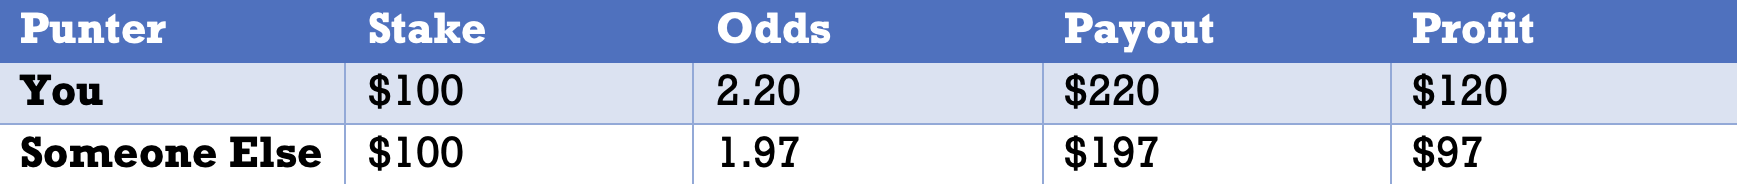
Difference: $120 – $97 = 💰 $23 advantage
Just by getting the best odds, you gained $23 extra profit on the same bet!.
That’s why monitoring line movement is so powerful. It helps you time your bets and maximize value.
In the next lesson, you’ll learn about the different types of bookmakers Sharp vs Soft and why it matters which ones you bet with.