
Chapter 5: Data-Driven Sports Betting · Lesson 4
By Cadell Griffith, Software Architect and founder of OddsFantasy · Updated · 5 min read
Bet tracking is recording every bet you place, with its stake, odds, result and closing odds, so you can measure your real performance instead of guessing it. A tracking sheet needs ten columns and two formulas: profit per bet and CLV (your odds ÷ closing odds − 1). Six bets of $10 that make $5 profit are a yield of 8.3%; whether that is skill or luck takes thousands of bets to tell from profit, and far fewer from CLV.
By the end of this lesson, you should be able to:
One of the key differences between professional punters and casual punters is bet tracking.
Without a record, you don’t know whether you’re profitable. With one, you see your strengths, your leaks and whether your strategy has an edge.
Set up one row per bet, with these columns:
| Column | What goes in it | Example |
|---|---|---|
| A: Date | When you placed the bet | 2026-10-16 |
| B: Event | The match | Team A vs Team B |
| C: Selection | Market and outcome | Over 2.5 goals |
| D: Bookmaker | Where you bet | Stake |
| E: Odds | Decimal odds you took | 2.10 |
| F: Stake | Amount risked | 10 |
| G: Result | W (win), L (loss) or P (push) | W |
| H: Profit | Formula below | 11.00 |
| I: Closing odds | The last price before the start, ideally at a sharp bookmaker | 1.95 |
| J: CLV | Formula below | 7.7% |
The two formulas, for row 2 of a spreadsheet:
Profit (H2) = IF(G2="W", F2*(E2-1), IF(G2="L", -F2, 0))
CLV (J2)    = E2/I2 - 1
And the summary cells for the whole sheet:
Total staked     = SUM(F:F)
Profit           = SUM(H:H)
Yield            = Profit / Total staked
ROI on bankroll  = Profit / Starting bankroll
Win rate         = COUNTIF(G:G,"W") / (COUNTIF(G:G,"W") + COUNTIF(G:G,"L"))
Average CLV      = AVERAGE(J:J)
| Selection | Odds | Stake | Result | Profit | Closing odds | CLV |
|---|---|---|---|---|---|---|
| Over 2.5 goals | 2.10 | $10 | W | +$11.00 | 1.95 | +7.7% |
| Home win | 1.85 | $10 | L | −$10.00 | 1.80 | +2.8% |
| Under 2.5 goals | 1.95 | $10 | L | −$10.00 | 2.00 | −2.5% |
| Away win | 3.40 | $10 | W | +$24.00 | 3.10 | +9.7% |
| Draw no bet | 1.70 | $10 | P | $0.00 | 1.72 | −1.2% |
| BTTS Yes | 1.90 | $10 | L | −$10.00 | 1.80 | +5.6% |
| Summary | Value |
|---|---|
| Total staked | $60 |
| Profit | +$5.00 |
| Yield | 5 ÷ 60 = 8.3% |
| ROI on a $1,000 bankroll | 5 ÷ 1,000 = 0.5% |
| Win rate (pushes excluded) | 2 of 5 = 40% |
| Average CLV | +3.7% |
A 40% win rate sounds bad, yet the sheet is in profit: the two winners were at odds of 2.10 and 3.40. That is why you track yield and CLV, not wins.
A single bet’s result is all or nothing, so profit is noisy. For flat stakes at average odds o, the 95% range around your measured yield after n bets is roughly:
95% range ≈ ± 1.96 × √(o − 1) ÷ √n
| Bets tracked | Odds 1.50 | Odds 2.00 | Odds 3.00 |
|---|---|---|---|
| 100 | ±13.9% | ±19.6% | ±27.7% |
| 250 | ±8.8% | ±12.4% | ±17.5% |
| 500 | ±6.2% | ±8.8% | ±12.4% |
| 1,000 | ±4.4% | ±6.2% | ±8.8% |
| 2,500 | ±2.8% | ±3.9% | ±5.5% |
| 5,000 | ±2.0% | ±2.8% | ±3.9% |
Read it like this: after 100 bets at odds of 2.00, a measured yield of +10% is consistent with a true yield anywhere from −9.6% to +29.6%. To prove a 3% edge from profit alone you need about 4,300 bets at odds of 2.00, and 8,500 at odds of 3.00.
Closing line value (line movement) doesn’t wait for results. A bet’s CLV is known the moment the event starts and usually moves by a few percent, not by the whole stake. A steady positive average CLV over a few hundred bets is a far stronger sign of an edge than a few hundred bets of profit. Track both: CLV tells you early whether the strategy works, profit confirms it.
When I started with data-driven sports betting, I logged my bets in a Google Spreadsheet, with a $300 bankroll spread over three bookmakers.
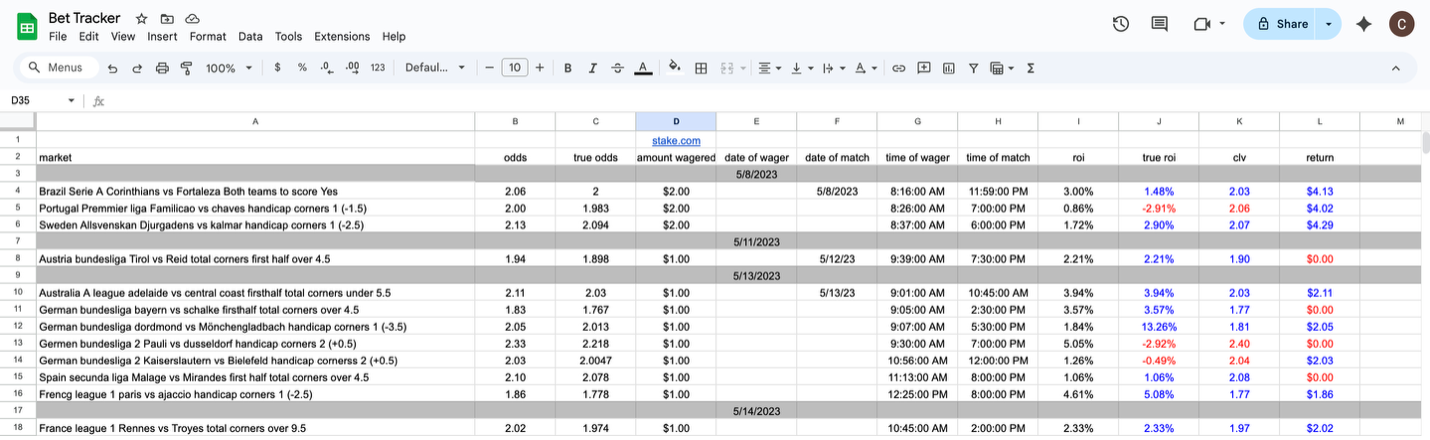
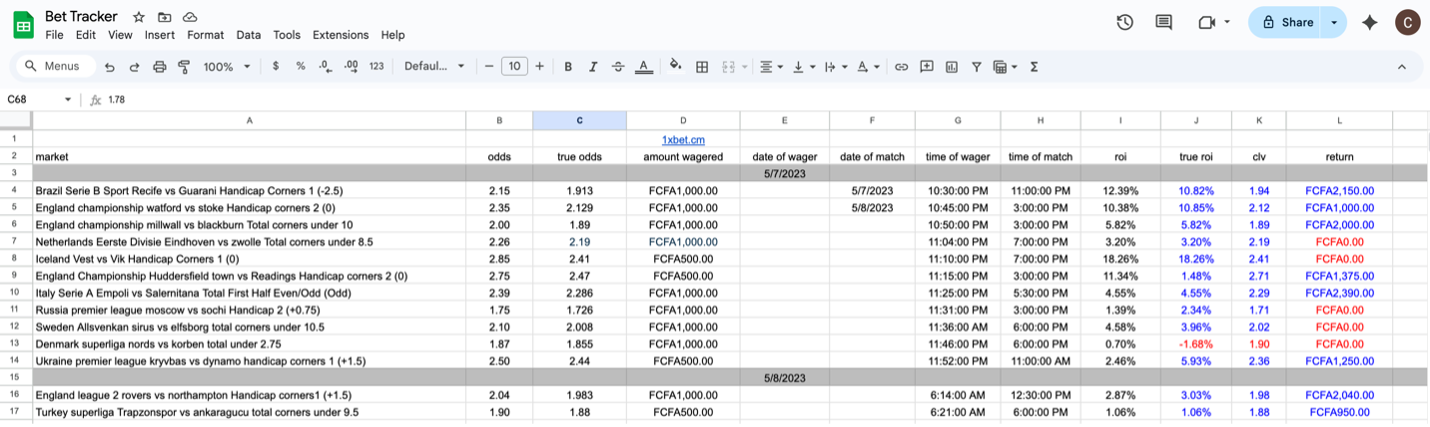
Good bets don’t last, so time spent logging is time you’re not betting.
I moved to the OddsFantasy Bet Tracker, where every bet and trade is logged with its stake, odds and result, and the dashboard charts profit, wagers and bets over time by bookmaker, market and sport.
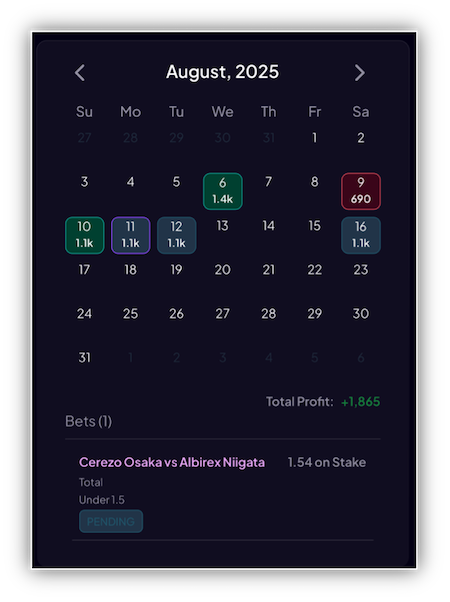
With one click, I can:
How to read the dashboard is covered in the OddsFantasy trade tracker, and the bet-by-bet record in trade history.
You must track your bets. How you do it is up to you:
You’ve now learned how to:
In the next lesson, you’ll put it all together and place a positive EV bet, step by step.
Record every bet the moment you place it: date, event, market and selection, bookmaker, odds, stake, result and the closing odds. Then calculate profit per bet and, across all bets, total staked, profit, yield and average closing line value (CLV).
Columns for date, event, selection, bookmaker, odds, stake, result (W, L or P), profit, closing odds and CLV. Profit = IF(result="W", stake × (odds − 1), IF(result="L", −stake, 0)) and CLV = odds ÷ closing odds − 1.
Yield is profit divided by the total amount staked, also called ROI on turnover. $5 profit from $60 staked is a yield of 8.3%. ROI on bankroll divides the same profit by your starting bankroll instead.
Thousands. At average odds of 2.00, the 95% range around your yield after n bets is about ±196% ÷ √n: ±19.6% after 100 bets, ±6.2% after 1,000 and ±2.8% after 5,000. Proving a 3% edge from profit alone takes about 4,300 bets.
Because it tells you whether you have an edge long before profit does. A bet's result swings between losing the whole stake and winning several times it, while its CLV moves by a few percent, so a steady positive CLV shows an edge after a few hundred bets.